 by Gino D’Alessio
How to use Stochastic modelling
Third parameter: Slow/Fast
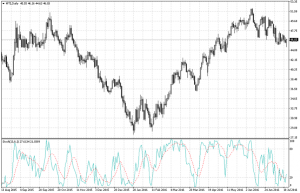
The original stochastic oscillator as introduced by George Lane uses a “Fast Oscillator” as the %K is drawn on the chart according to the calculation shown in Part 1. The chart below shows how this oscillator looks. As you can see, the %K line which is the light blue line is very volatile and can lead to many false readings.
 Whereas, adding a smoothing factor to the %K line, we get the less volatile line referenced in Part 1. This is achieved by calculating the %K as a simple moving average (SMA) of %K. The common number to use for the look-back period is 3, known as a “Slow Stochastic.” However, again I feel that experimentation with this number can lead to better results. In the above chart, the %K line is slowed using a simple moving average of 8 periods, while %K is calculated over 14 periods.
Probably out of the need to simplify the first oscillators used 3 periods in their SMA calculations. Nowadays all technical analysis software will allow you to assign a number of your choice for the look-back period for the %K as well as the number of periods to smooth the %K and for the %D.
How to use the oscillator
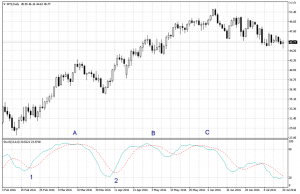
Looking at the chart below we can see how this indicator flows up and down as the price of crude oil (in this example) fluctuated in one direction and then the other. One trigger that tells us when we should be looking to go long or short is cross-overs of the %K line with the %D line. When the oscillator is closer to the higher boundary and crosses the %D line to the downside, you should be considering short positions. In the chart, these signals correspond to the areas marked A, B, and C.
When the %K line is in the lower part of the boundary and crosses the %D line from below (on an upwards trend) then you should be looking to consider long positions, these points correspond to the areas marked with the numbers 1 and 2.
 The crossovers must penetrate through the level of 80 to the downside and the lower level of 20 to the upside. When there is a strong rally or rout the %K line may cross the %D line various times while remaining above 80 or below 20. The signals that occur on those areas of the chart are not to be taken into consideration, as the momentum is still extremely high and it is likely that the direction of the market will continue. These levels at 80 and 20 have long been established as “thresholds”, so users of Stochastics will always take notice as the value passes through these levels.
Summing up
The stochastic oscillator is a great tool, and modern software is powerful enough to allow us to play around with the parameters to tweak this indicator to give the best results for each time frame and market. Again, it is not by any means a stand-alone tool, which goes for many other technical analysis theories too. It will always create a more powerful analysis when used in conjunction with other tools.
Similarly to other momentum and price action measures, stochastic values can be checked across multiple timeframes to either back up, or perhaps warn against, particular trades. They are a useful addition for traders to add to their list of tools. Most charting available with online brokers will include some technical analysis tools which can be toggled on or off, so it is worth taking a quick look at these oscillators when the opportunity arises.
Read Part 1 of our Stochastic definition here.
The charting features at IG, include Stochastic Oscillators, with configurable parameters;

![]()
 by Gino D’Alessio